These 3 charts hint the stock market rally will continue now that there's a US-China phase one trade deal
The remarkable stock market rally of 2019 looks poised to continue into the New Year as the bulls have received their multiple pounds of flesh in December.
Among the biggest pounds of flesh heaped onto the plate of the bulls is no doubt the new “phase one” trade deal President Trump announced Friday with China. Under the deal, the U.S. will cancel tariffs on Chinese goods that were poised to go into effect on Sunday. China will in turn purchase a “significant” amount of U.S. agricultural products. A precise amount was not disclosed.
Trump added on Twitter that the administration would leave 25% tariffs on $250 billion in China imports in place. Existing duties on $120 billion in products were cut to 7.5%.
Stocks consolidated gains on the news following a big rally for much of the week.
Besides the trade standoff cooling down, if just for now, investors have enjoyed strong indications from the Federal Reserve it won’t be hiking rates anytime soon and incrementally better U.S. economic data this month.
All in all, there are simply more reasons to be bullish on stocks than bearish most pros say.
“I think underlying some of the fundamentals of the market, we are still seeing some better news. That is also helping the backdrop,” Invesco strategist Tim Horsburgh said on Yahoo Finance’s The First Trade.
AdvisorShares founder Noah Hamman added, “We are less concerned about tariffs and China. We are really looking at where the U.S. is right now, what’s going to happen with interest rates and the Fed’s balance sheet. We see that liquidity coming into the market. That has continued to drive the market higher. It doesn’t fix company fundamentals, but it does drive prices higher.”
The optimism is starting to spread in the markets, as seen in the below charts from Sun Dial Capital Research. And the historical data behind the chart moves suggests it will be risk on in the near-term.
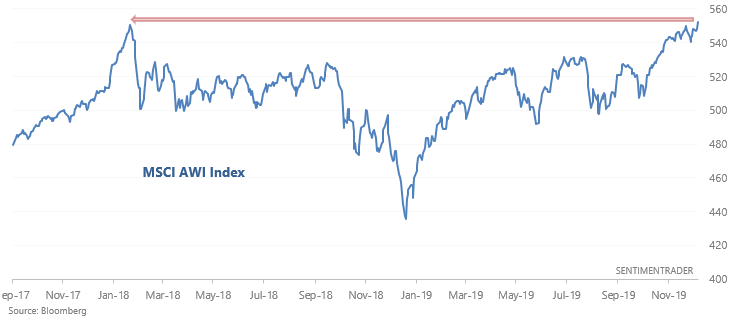
Chart 1: The global rally returns
The MSCI ACWI Index, which measures the performance of emerging and developed markets, has broken out a new two-year high. Historically after the MSCI ACWI Index breaks out to a two-year high after more than 400 days, the S&P 500 has rallied by a median 5.1% over the next six months. The one-month median gain following the breakout is 10.4%, according to Sun Dial Capital Research.

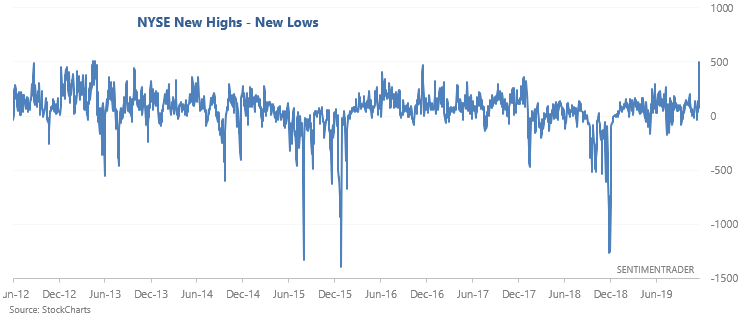
Chart 2: New highs surge
The number of new highs on the NYSE has surged in recent weeks back to levels not seen since Dec. 2016. When new highs versus new lows on the NYSE exceed 400 (currently at 500 as seen below) for the first time in about a year, the S&P 500 has gone onto rally a median 15.4% during the next year.

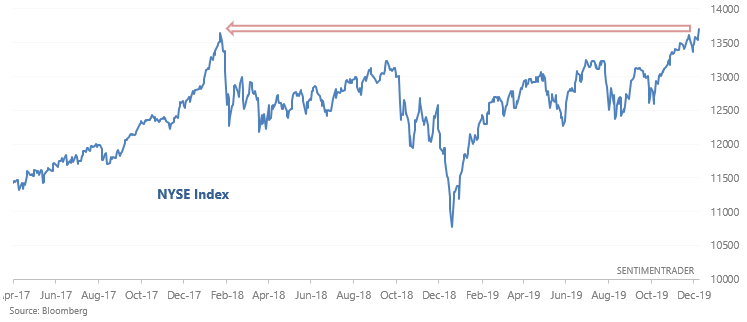
Chart 3: NYSE kicks into high gear
The NYSE Composite Index, which includes more than 1,900 stocks, reached a record high on Dec. 12. When the index has broken out to new highs in the past, Sun Dial Capital Research notes the median gain one year from the breakout has tallied 9.9%.

Brian Sozzi is an editor-at-large and co-anchor of The First Trade at Yahoo Finance. Follow him on Twitter @BrianSozzi
Read the latest financial and business news from Yahoo Finance
Beyond Meat founder: things are going very well with McDonald’s
Starbucks CEO on what China has in store for the coffee giant
Follow Yahoo Finance on Twitter, Facebook, Instagram, Flipboard, SmartNews, LinkedIn, YouTube, and reddit.
